|
Traffic went up 5×. Demand didn't move. And the
ruler I measure providers with changed underneath
everyone.
Week of July 27 – August 2, 2026 · 25,933 providers ·
108,265 APIs indexed
Every Monday I read what people and agents actually typed
into apis.io — the search box and the MCP server — as a demand signal
for the API economy. Nobody else has this data, so nobody
else can send you this email.
This week the data tried to lie to me twice. Both times
the honest number is smaller and more interesting than the
headline. Here they are anyway.
📈 The Demand Report
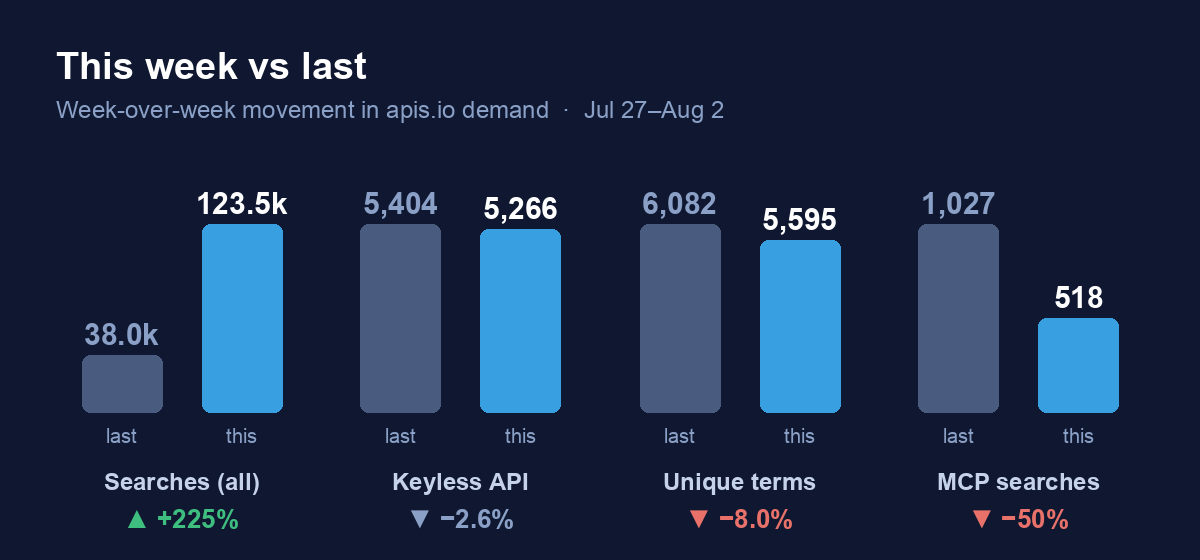
123,498 searches, up 225% week over week. Ignore that number. I'm printing it because
I'd rather show you the one I threw out than quietly
not mention it.
Requests to the apis.io API are logged by tier. internal means no API key and an apis.io origin — the site
calling itself, every page render, every crawler walking
those pages. keyless means somebody hitting the API directly from outside.
The split:
|
|
Last week
|
This week
|
|
|
Internal (the site itself)
|
32,611
|
118,232
|
+263%
|
|
Keyless API (outside callers)
|
5,404
|
5,266
|
−2.6%
|
|
MCP server
|
1,027
|
518
|
−50%
|
|
|
This week vs last: total searches +225% to 123.5k,
keyless API flat at 5,266, unique terms −8% to
5,595, MCP searches −50% to 518
|
All of the growth is the site being crawled. Google Analytics puts the week at 502,881 sessions
against 95,693 the week before. 422,260 of them — 84% — came from Singapore, up from 37,859. Vietnam contributed another 44,185.
Average session: 12 seconds. Sessions peaked at 170,183 on
July 29 and collapsed to 37,634 the next day. CloudFront
requests rose 50% to 9.5 million and the error rate went
from 10.55% to 16.49%, which is what a
bot walking URLs that don't exist looks like from the
edge.
United States sessions over the same week: 33,189 →
37,873. Up 14%. That's the human line, and it's
the only one I'd put weight on.
So here is the actual week. Outside
demand was flat. Unique search terms fell 8%, from 6,082
to 5,595. And the line I led with last issue went the
other way.
Last week I told you agent searches tripled — MCP
traffic up 231% to 1,027. This week it halved, to
518. One week is not a trend, and neither was the up-week.
I'd rather hand you the reversal than only report the
direction that flattered the thesis. Two data points and a
reversal is what I have; when I know why, I'll tell
you.
One more number I'm throwing out. The top search term this week was "Automation Preflight API" — 1,185 times, against 96 for the runner-up. It resolves
to exactly one fuzzy match in the whole catalog (Adobe
InDesign, on the phrase "preflight automation"
buried in a description). A single term at twelve times
the volume of everything else, pointed at one weak match,
is a machine in a loop, not a person shopping.
What's left, after all that, is a boring and
genuine top-of-list: SCIM (27), Comcast (18), Stripe (18), Twilio (15),
weather (16), football (16), payments (10), Chart of
Accounts (10), Digital Asset Management (9), Permission
Sets (10), Shipping Accounts (9), Allow Lists (8).
Identity plumbing, the usual integration primitives, and a
long tail of people with a specific enterprise object to
move. That list barely changes week to week, and that
stability is the point: the agentic layer is being added
on top of this, not instead of it.
And the Pro-tier signal, which is its own kind of
demand: 29 attempts on ratings, 15 on changes, 9 on me, 5 on security, 4 each on scopes and compare. People keep reaching for the scoring data and the
change feed specifically.
🕳️ The Gaps (demand we couldn't answer)
279 distinct terms came back empty, up from 263. Supply
grew — 494 providers and 1,339 APIs added this week — and
the gap grew anyway.
A note on method: the raw unanswered list had 695
terms; 416 were dropped as noise. That filter is
imperfect and I can see exactly how: it strips single
common English dictionary words using the system US
wordlist, so this week's crawler got through on
British spellings — Anaesthetise, Civilisation,
Disincentivise, Fantasise, Jeopardise, Agonise. Fixable,
and now on the list.
The two loudest unanswered searches this week
weren't categories. They were domains. archlending.com (21×) and chainfi-finance (21×) — each searched roughly two dozen times, each
returning nothing every time. That is the shape of a
company typing its own name into an index to see whether
it's there, and finding out it isn't. If that
was you: it takes about two minutes to fix, and the link
is at the bottom of this section.
|
|
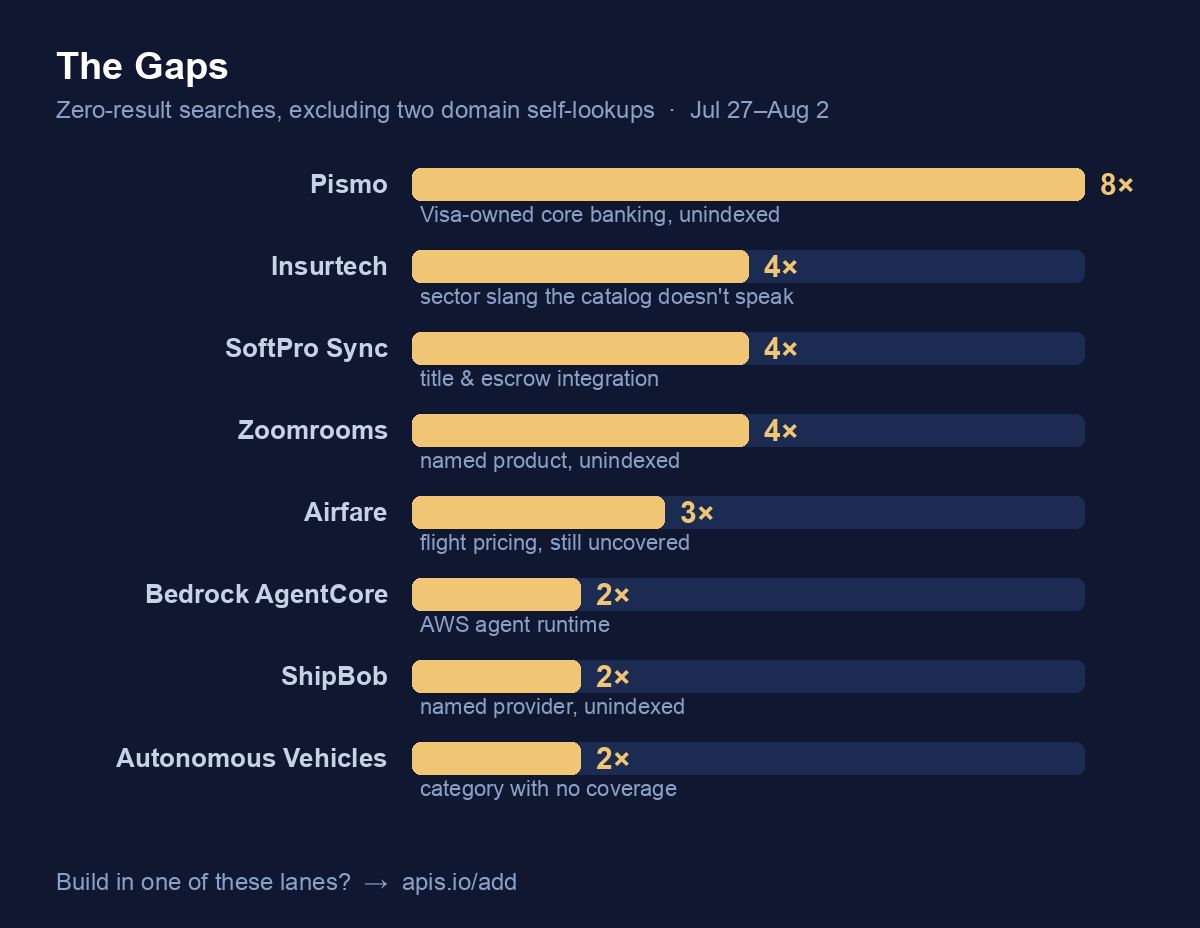
The Gaps — top zero-result searches excluding two
domain self-lookups: Pismo 8×, Insurtech, SoftPro
Sync and Zoomrooms 4× each, Airfare 3×, Bedrock
AgentCore, ShipBob and Autonomous Vehicles 2× each
|
The sharpest real gap is Pismo — searched
21 times, empty 8 of them. Visa-owned core banking and
card processing, and the index has nothing. That's a
genuine hole in a sector I write about constantly.
Named products nobody has submitted: SoftPro Sync, Zoomrooms, Bedrock AgentCore, ShipBob,
anam.io, coinglass, statseeker, inpay, logmate, airnow,
Adyen Hosted. Someone specifically wanted your API this
week and got nothing.
Sector slang the catalog doesn't speak: Insurtech (4×), Healthtech (2×), legal tech (2×) — all
empty. People search by the word the industry actually
uses; the catalog indexes by something more literal.
That's a vocabulary gap I own, not one a provider can
fill for me.
Categories with no coverage: Airfare,
Autonomous Vehicles, Fusion Energy, Circular Economy,
Civic Technology, Credit Union Offices, Tribal Governance,
Fluoropolymers and Fluorochemicals.
And one I have to own outright. "Greater China" was searched twice and returned nothing — on a week when
apis.io published an analysis of API coverage across Greater China. The post exists. The search box can't find it.
That's a defect on my side, not a gap in the market.
A methodology finding worth naming,
because it changes how you should read any zero-result
list including mine: the unanswered log captures
search-as-you-type. apifre → apifrea → apifreak → apifreaks → apifrek →
apifreka is six entries at 2× each. It's one person, typing,
once. Same with Pygeo → Pygeoa → Pygeoap and commoditypric → commodityprice. Nobody has deduplicated keystroke ladders out of a
public demand feed, so treat the low-count tail everywhere
— mine included — as noisier than it looks.
If you build in one of these lanes, this is your
invitation. Add your API in about two minutes: apis.io/add — or point your agent at the apis.io MCP server and let it submit for you.
🆕 New to the Index
The catalog grew by 494 providers and 1,339 APIs this week, to 25,933 and 108,265. Two provider profiles
published since the last issue:
-
Merge — 118 APIs, 117 specs; Kin
Score 75.3 (exemplar), Agent
Readiness 63.5 (agent-native). Ten collections, and
each one is a category rather than an
endpoint group — accounting, ATS, CRM, HRIS,
ticketing, file storage, chat, knowledge base, plus a
dedicated Agent Handler surface (Unified API)
-
Kong — 139 APIs, 132 specs; Kin
Score 63.4 (strong), Agent Readiness
59.6 (agent-ready). Two collections across 139 APIs,
the coarsest decomposition in the sweep (API Infrastructure)
Kong is the one worth sitting with. The company whose business is helping others run their
APIs well scores strong, not exemplar — below Adyen (77.8), Palo Alto Networks (75.3), Merge
(75.3), FactSet (73.5) and Slack (73.1) from the same
sweep. The reason is architectural rather than negligent,
and it's in the full profile.
Also published this week: the MCP server index, the Y
Combinator portfolio's API footprint, OAuth scopes
across the catalog, and the open-source tag. All on the apis.io blog.
⭐ Rated This Week: I changed the ruler
No provider this week. The rubric itself is the story, and
if I ranked somebody on top of it without saying so first,
the ranking would be worthless.
Between last issue and this one, the Kin Score went
from 0.5.1 to 0.9 — four releases, all on July 31 — and
the whole index was re-scored on August 3. Nobody's API changed. The measurement did.
Here's what moved and why, because a score you
can't audit is just an opinion with a number
attached.
0.7 — security defects a contract declares about
itself. Three new checks, measured first across 14,195
as-published OpenAPI documents: contracts declaring the
OAuth implicit grant (775 of them) or
resource-owner-password (72), both removed in OAuth 2.1;
API keys passed in: query (815), where the credential lands in logs and referrer
headers; and OAuth schemes that enumerate no scopes at all
— only 15.3% of contracts enumerate any.
All three score the presence of a defect, not the
absence of a feature, so a bearer-token API passes all
three vacuously. 25,574 providers re-scored, 0 errors.
0.8 — provenance grading, finally applied to
everything. We write OpenAPI specs for providers who haven't
published their own. Until 0.8, only one check discounted
that; the other 112 points of contract quality credited
providers for our craftsmanship. Now the whole
block is graded down to a 0.25 floor when the corpus is
ours. Measured against the live catalog before
shipping: 318 providers moved. All 318 fell. None rose. 187 changed band, including 16 that dropped from exemplar to strong. The canonical case: Yardi, 57.7 → 49.6, strong →
developing, because its entire spec corpus was ours and it
had been strong on the strength of it.
0.9 — the dimension was named after an artifact and
measured the wrong thing. asyncapi_events only looked in the asyncapi/ directory. But OpenAPI 3.1 has a top-level webhooks object and callbacks has existed since 3.0. Across the verbatim harvest
archive, 125 providers describe their event surface that
way — 87 via webhooks covering 2,218 individual events, 39 via callbacks covering 174 — against zero who publish
AsyncAPI. So 100 providers were scoring false on a dimension they satisfy, in the contract they
actually maintain. Renamed event_surface_described and widened.
What that did to last week's headline. In Issue #02 I told you Alpaca was the top-rated
provider in the index at 86.4. Today the catalog
reports 85.2, and it is no longer first.
Two of its facets went up over that window —
governance 60.5 → 68.8, contract quality 69 → 71.3 — and
the composite still fell, because discoverability (100 →
92.6) and the conditional securities-regulatory layer (100
→ 86.7) are measured against denominators that got longer.
Alpaca did nothing wrong. It's a very good API
profile. It's being graded harder.
And it will move again. Kin Score 0.9.1
shipped this morning: the scorer was classifying
specifications by looking for an openapi: declaration, so a Swagger 2.0 document — which
declares swagger: "2.0" and uses definitions and securityDefinitions — was dropped before a single check ran. A provider whose entire corpus is Swagger 2.0 was
scored as publishing no contract at all. 190 such documents across 90 providers in a 3,024-file
sample, Microsoft Azure heaviest, then Kaltura, Mailchimp,
Mastercard and Zuora. Rebuilding the index with the fix
took it from 81,867 to 87,680 documents across 6,997 to
7,200 providers, and cut parse errors from 800 to 126.
Those corrected scores are held until the next full
rebuild, so what you see on apis.io today is still 0.9.
It surfaced because Oracle publishes a first-party
contract for all 161 of its Cloud Infrastructure services,
7,918 operations. Harvesting them to replace six
specs we had
written lowered Oracle's contract
quality — the six models were the only documents the
reader could parse. A provider was being scored on our
modelling and penalised for its own engineering.
That's the honest state of it. The
rubric is public and versioned precisely so this is
auditable rather than mysterious: github.com/api-evangelist/kin-score. If your score moved and you want to know which check
did it, ask me and I'll send you the line item.
The bands, for reference: exemplar 70+ · strong 60–69 ·
developing 45–59 · thin 30–44 · minimal 0–29.
🤖 Reproduce this yourself
Everything above came out of public apis.io surfaces.
Paste this into your agent (apis.io MCP) to pull the
current top of the index — scored on rubric 0.9, as of
August 3:
find_providers(sort="composite", limit=25, fields=["slug","name","score"])
Compare it to the same call next week and you'll see
0.9.1 land.
Or check the demand data directly: apis.io/search-terms/ — the top 100 searches and the top 100 unanswered ones,
refreshed every Monday.
25,933 providers. 108,265 APIs. 5,266 keyless searches
that were actually yours. 279 still unanswered. See a gap that's yours? → apis.io/add
The Demand Report is a weekly read of apis.io's
own search + discovery signal. Forward it to someone who
ships an API.
|